
The Ocean Observing and Modeling Group at NC State University is closely watching Hurricane Dorian as it moves northward along the U.S. Atlantic coast. Using our Coupled Northwest Atlantic Prediction System (CNAPS), we are providing a 3-day forecast of the hurricane’s path and intensity, updated daily.
CNAPS models ocean conditions, atmospheric conditions, and the interaction between them. This interaction is crucial for accurate forecasting, because a hurricane is as much an ocean event as it is an atmospheric event. Ocean conditions that the storm moves over contribute to the storm’s intensity and translation (horizontal movement) speed.

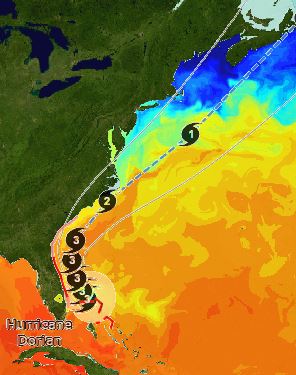
The CNAPS model has three resolution levels, to examine conditions at different scales. Level 1 shows the big picture. Level 2 zooms in for more detail over the Carolina-to-New York coast, and Level 3 has the finest resolution over North Carolina, with details such as the Pamlico-Albemarle Sound.
Each site displays layers of information including sea surface temperature, sea surface height, salinity, significant wave height, and wave direction. These sites (one for each Level) are available to the public during this hurricane. Click these images to go to the interactive Level 1, 2, and 3 websites.